


 DEVELOPED BY In development
 Know your assets. Plan with confidence.
GENESYS AMS & LES keeps one record per asset, scores its condition from tests, inspections, online monitoring and robot findings, and estimates its remaining life with the confidence band shown. Maintenance follows the condition, not the calendar.
- Thermal imageOne connection running hot
- On watchHealth of this transformer
- Thermal imageOne connection running hot
- On watchHealth of this transformer
A transformer can serve for decades. How much life is really left in it?
The evidence usually exists. It is just spread across systems, reports and notebooks, so maintenance follows the calendar because nothing better is at hand.
Records in many places
Nameplates in one system, oil tests in a lab report, inspection notes on paper. Nobody sees the whole asset at once.
Maintenance by the calendar
Fixed intervals send crews to healthy assets and can miss the ones that are ageing faster than planned.
One number nobody trusts
A single remaining-life figure hides how uncertain it is, so it is either trusted too much or ignored.
Every score names what it was built from.
Each part of a transformer ages in its own way, and each has its own evidence. AMS & LES reads four kinds of it and stores each against the asset it describes, so a planner can open a health index and see the test, the inspection or the reading that moved it.
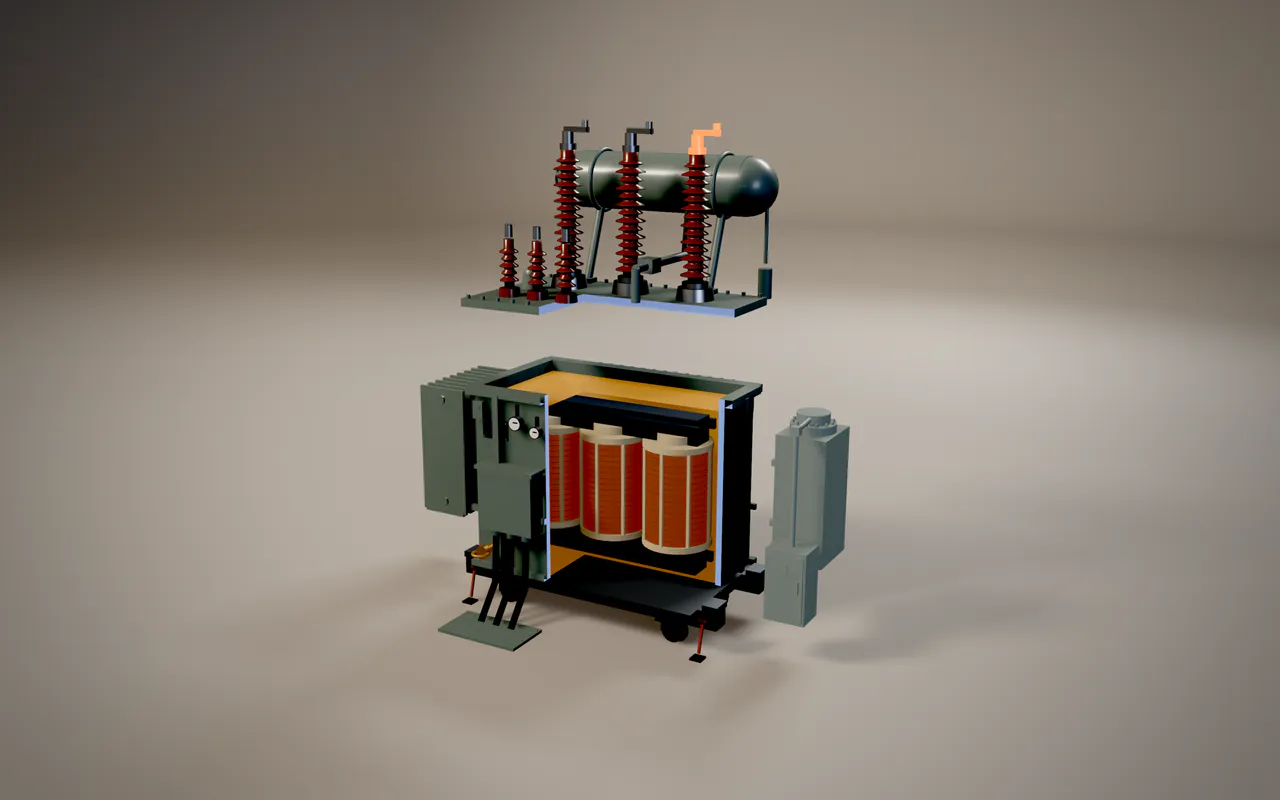
- BushingsChecked by thermal photo
- OilSampled for dissolved gases
- Tap changerChecked by test records
- BushingsChecked by thermal photo
- OilSampled for dissolved gases
- Tap changerChecked by test records
Nameplate and history
- Ratings, cooling, year of manufacture
- Drawings and test reports
- Faults and repairs
Tests
- Dissolved gas analysis
- Oil quality and moisture
- Insulation and winding tests
Inspections
- Robot and drone rounds
- Thermal and acoustic readings
- Crew inspection notes
Online monitoring
- Load and temperatures
- Online gas monitors
- Breaker operation counters
- 12 inputs
- Thermal ageing
- Gas trend
Health index
0 to 100 per asset, with the inputs that set it.
Remaining life
Median and 80% band, model named.
Maintenance plan
Work orders by condition, on one timeline.
Every score shows its evidence, so planners can trust it and check it.
What is inside AMS & LES
- Asset register. Sites, bays and assets in one tree, with nameplates, drawings and test reports.
- Health index. A 0 to 100 score per asset from tests, inspections, online monitoring and robot findings.
- Life estimation. Remaining-life curves with an 80% confidence band and the inputs that moved them.
- Maintenance planning. Condition-based plans, work orders and crew schedules on one timeline.
- Fleet view. Health and remaining life across every site in one matrix.
A median and a band, always together.
This is the estimate for the transformer above. Drag across the chart, or focus it and use the arrow keys, to read any year. The band is part of the answer, not a footnote.
Health index of the transformer in bay three, forecast from 62 today. Most likely it reaches the replace limit of 30 in 2040; with 80% confidence, as early as 2038 or as late as 2044. That is the replacement window.
Drag across the chart, or focus it and use the arrow keys. 2026 (today): health 62
Plan the replacement window, not a guess.
Which assets need attention first, and why.
Across every site, the assets that need attention move to the front. The fleet board shows where they are; the register and the plan show what happens next.
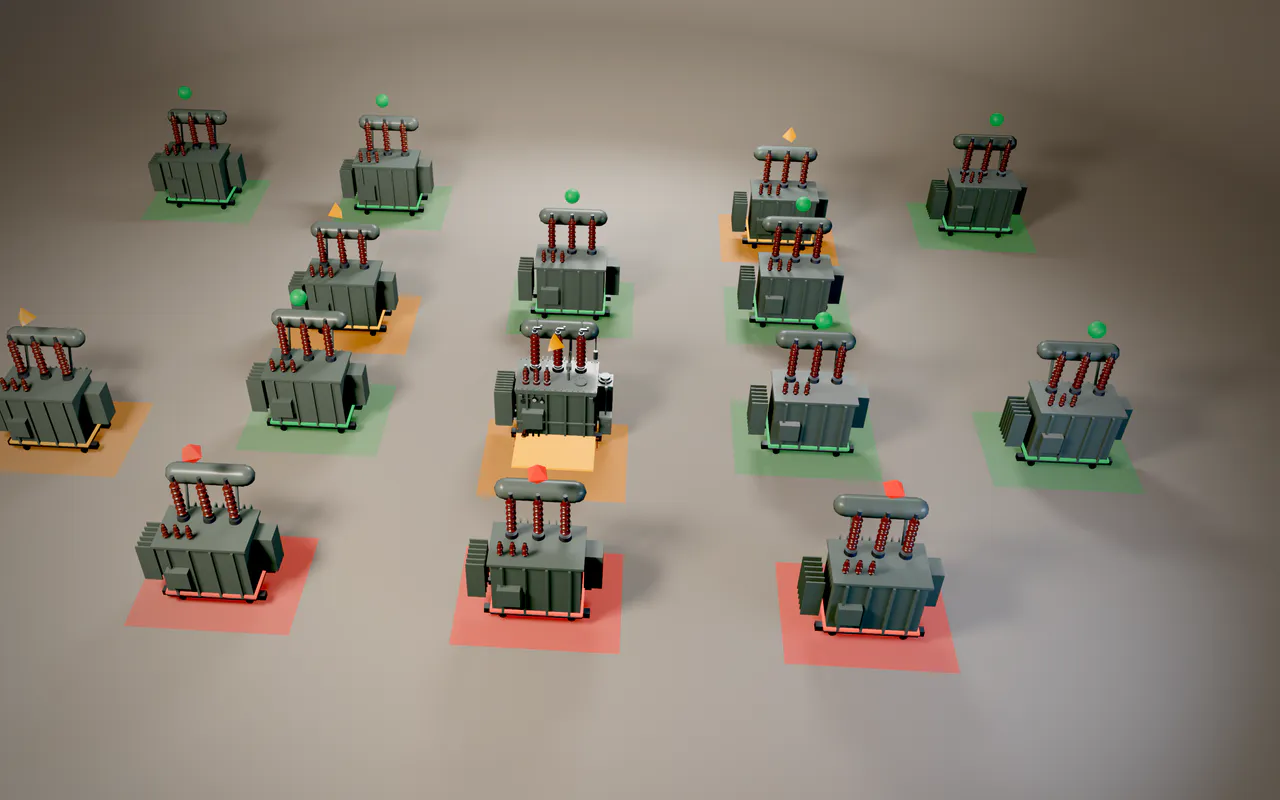
- Act nowValley
- Act nowMain substation
- Act nowHilltop
- Act nowValley
- Act nowMain substation
- Act nowHilltop
| Site | Transformers | Breakers | Lines | Relays |
|---|---|---|---|---|
| Valley | Worst state Watch. 4 good,1 on watch,0 poor | Worst state Poor. 10 good,3 on watch,2 poor | Worst state Watch. 5 good,1 on watch,0 poor | Worst state Watch. 12 good,2 on watch,0 poor |
| Hilltop | Worst state Watch. 3 good,1 on watch,0 poor | Worst state Poor. 7 good,2 on watch,1 poor | Worst state Poor. 4 good,2 on watch,1 poor | Worst state Watch. 9 good,2 on watch,0 poor |
| Main substation | Worst state Watch. 3 good,2 on watch,0 poor | Worst state Poor. 8 good,2 on watch,1 poor | Worst state Watch. 5 good,1 on watch,0 poor | Worst state Poor. 10 good,3 on watch,1 poor |
| Riverside | Worst state Poor. 2 good,1 on watch,1 poor | Worst state Poor. 5 good,2 on watch,1 poor | Worst state Watch. 3 good,1 on watch,0 poor | Worst state Watch. 7 good,2 on watch,0 poor |
| North yard | Worst state Watch. 1 good,1 on watch,0 poor | Worst state Watch. 4 good,1 on watch,0 poor | Worst state Good. 3 good,0 on watch,0 poor | Worst state Poor. 7 good,1 on watch,1 poor |
- Good
- Watch
- Poor
Each cell is a site and an asset class: how many assets are good, on watch and poor. The cell colour shows the worst of them.
Attention first
- 1Hill line breaker, Valley substationGas pressure falling; health 38Poor
- 2Transformer, bay three, main substationHot connection and rising gases; health 62Watch
- 3Breakers at HilltopOne poor, two on watchWatch
| Asset | Site | Health | Remaining life | State |
|---|---|---|---|---|
| Transformer, bay three110/35 kV transformer | Main substation | 62 | 14.2 y | Watch |
| Second transformer110/10 kV transformer | Main substation | 81 | 22.6 y | Good |
| Hill line breaker110 kV gas-insulated breaker | Valley substation | 38 | 4.1 y | Poor |
| Hill line35 kV overhead line | Valley to main | 74 | 18.0 y | Good |
| Line protection relayDistance protection | Hilltop substation | 69 | 9.5 y | Good |
- 2026 Q4PoorHill line breaker, Valley substationReplace the gas seals and retest
- 2027 Q1WatchTransformer, bay threeOil test, cooling fans group two
- 2027 Q2GoodLine protection relay, HilltopFunctional test and settings review
- 2028 Q3WatchTransformer, bay threeCapital plan review: the replacement window opens
Budgets go where they matter, and work is planned by condition, not by the calendar.
How to read an estimate, and what to do next.
Each estimate names its model and its inputs: for a transformer, typically a thermal ageing model driven by load and ambient temperature, the trend of dissolved gases from oil tests, and inspection findings.
A wide band: collect data first
The record is thin: few tests, a short history or readings that disagree. An extra oil test or an online monitor is usually worth more than an early replacement.
A narrow band near the limit: plan it
When the band crosses the replace limit inside the planning horizon, the asset belongs in the capital plan, with the evidence attached.
Every change has a cause
When a new test arrives the estimate moves, and the record shows which input moved it, so a planner can tell a measurement from a model change.
Life estimation does not replace engineering judgement. It summarises the record so it can be compared across a fleet. Read the note: remaining life, with the error bars shown.
GENESYS AMS & LES, in brief
One record per asset, a clear picture of its health, and what to fix first.
The film could not load here. Open the MP4 file or read the transcript.
See AMS & LES on your own assets.
A walkthrough with GENE and JUMPHASH on a sample of your register: nameplates, last tests and the health index they produce.